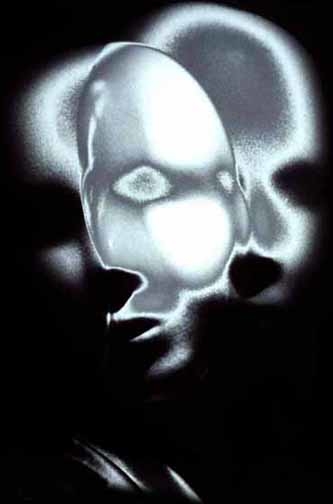
Top of this document
Go directly to navigation
Go directly to page content

The completometer

Devising a method for compelling authors to complete their contributions.

Since the purpose of Anymeta is partly to let users share their own content on the internet, we love to encourage them to make their content as complete as possible. To stimulate this behaviour, we designed the Complete’o meter widget.
This widget would remind authors of their progress in making the things they create complete, and also tell them of things that they still need to do.

To give the users an incentive to do these tasks, they need to know what those tasks help them with, and why they should even bother with these tasks. They need to know if what the do is worth it all.
This is accomplished by giving explanatory messages to each of the tasks on the meter: what their function for that particular thing is and how it helps if they are filled in.
To enforce the idea of urgence, the meter is very intrusive at first, taking up a large portion of space next to the thing in question on its page. As the tasks on the meter are completed, the user is rewered by the meter shrinking in size, making it less intrusive every time until it eventually disappears altogether.

Version 1

The first version was a quick sketch showing what elements would be in the meter design.
The tooltips seemed too far from their tasks to be recognized as a whole, and needed to appear next to each other. Completed tasks should always appear in the filled half of the meter. That way the user knows how far they have progressed in completing their publication.
I was asked to give the meter a percentual progress indicator, So the user has a better idea of how far they have progressed.

Version 2

In the second version, missing elements such as measurement lines and the precentage lable were added, and the task labels were turned into buttons. The buttons were given the same look as the edit buttons on the Mediamatic website, so users know that they are interactive. The tooltips were positioned in such a way that they stick to the bottom of the relating button, and to the side of the meter.

The next task was to think of a way to make the meter shrink nicely, and think of something to do with the buttons of completed tasks every time the meter shrinks. While the custom made mouseover tooltip is an interesting design addition, it was decided to use normal browser tooltips for now.

Version 3

For the third version, I created two slightly different versions that show how the shrinking of the meter and buttons of completed tasks would be handled. Furthermore the tooltip was changed to look like the default browser type.

Version A had its buttons of completed tasks removed. This puts extra emphasis on the fact that the previous tasks have been completed and no longer need to be worried about. This could however also be seen as definitive closure by the user and make them think that these tasks are not available anymore altogether. This design also loses some of its informative purpose, because the user can no longer see which specific tasks have already been completed.

Version B still kept all of its buttons during shrinking, with buttons of completed tasks instead appearing in a gray color to remind the user that these tasks have already been completed. This design gives clarity by showing which tasks have already been done in one quick glance. The only drawback is that as the meter begins to shrink, the distance between each button gets smaller, making the meter look more crammed with every shrink.

In the end, we discussed blending these two variants together: if the meter is in a shrunken state, the completed tasks are not visible. But if the mouse would be hovered over the shrunken meter, it would expand to full size, with completed tasks appearing as grayed out buttons.
To shrink the meter as much as possible, it was decided to cut off the “appendage” that hangs below with no buttons at all, reducing it instead to a partial fade-out to give a hint that more is to be seen if you hover over it with the mouse.

Version 4

The merged version also called for some more coloring, to give a more authentic meter feel and bring the design to life. The borders were changed from gray to black, and the meter “fluid” to the same color as the buttons. In the shrunken versions, the meter fluid is still slightly visible in the fade-out, to still give the appearance that the meter is being filled.
Another small difference with previous versions is that the meter begins at a percentage that is appropriate for the amount of required fields that have already been filled in. This was done because it would be inconsistent to have te meter report the profile is not complete at all, while parts have already been filled in.

Version 5

A few changes were made to streamline the design.

First, the labels were shortened as much as possible. Also, for things like Keywords, Images and body text, a recommended number was added to the end of the text label. The progress percentage of the meter is also determined by how close the user is to achieving the recommended amount.

Also, a title for the meter was added to the top , in combination with a sentence to motivate the user. This sentence would change according to how much progress was made on the contribution in question.

Another tweak is that when the meter is full, it totally disappears, only displaying the title and a sentence telling the user the contribution is complete. When they hover over the title, the meter appears, showing what has been done.